
Identify stronger cell engager candidates, earlier.
Make faster, higher-confidence candidate decisions with cell avidity data. Quantify binding kinetics and trimer formation to optimize and rank engager designs, and generate avidity EC50 and Hill coefficient profiles that feed directly into QSP and dose-projection models.
Why Cell Avidity?
Affinity alone can't explain how a cell engager performs
Across FDA-approved T-cell engagers, target-cell binding affinity spans nearly 2,800-fold, with little relationship to clinical outcome. Two candidates can look similar on an SPR assay, yet behave quite differently once tested on cells. This makes sense if you figure that protein-only assays capture a single binding event in isolation. Functional assays show an outcome, but not always the reason behind it. The decisive data is missing in between: how productively a candidate actually engages a target cell in the first minutes of contact. That gap can quietly contribute to late-stage failures and extra engineering cycles. Cell Avidity for cell engagers helps close that gap. It's an emerging measurement, built on assays already shown to speed up CAR-T development, applied to bispecific, trispecific, and multispecific formats to better understand the multivalent, cell-context-dependent binding that shapes real performance.
Overcome these challenges with Cell Avidity:
- Capture how candidates engage target cells in a cell-context that reflects biology more closely than protein-only assays;
- Tell apart candidates that look similar today by examining format, valency, and arm balance together;
- Generate standardized, dose-response avidity profiles (maximum avidity, EC50, Hill coefficient) that feed directly into pharmacokinetic and QSP models.
Avidity profiling identifies optimal CD3-TAA affinity balance for maximal T-cell engagement

For researchers developing T-cell engagers (TCE), one of the biggest unanswered questions is surprisingly simple: how to quantify productive connections are actually formed between T cells and tumor cells?
In collaboration with AMGEN, LUMICKS profiled cell avidity across five T-cell engager variants whose CD3 arm (T-cell binding) and TAA arm (tumor-binding) were independently tuned from low --> medium --> high.
Five T-cell engager variants with different combinations of CD3 and tumor-target (TAA) affinities showed a clear trend:
- Increasing CD3 affinity improves T cell–target binding, but only up to a point;
- Stronger TAA affinity provides the additional boost needed to reach the highest avidity levels.
- The strongest cellular engagement is achieved through the right balance between the CD3 and TAA arms, rather than maximizing either arm alone.
These findings suggest that affinity does not translate linearly into cellular engagement. Instead, avidity captures how both binding arms work together to drive productive T cell–tumor interactions.


1. Representation of the five T-cell engager variants, with different combinations of T-cell (CD3) and tumor-target (TAA) affinities (low, medium, high for each arm)
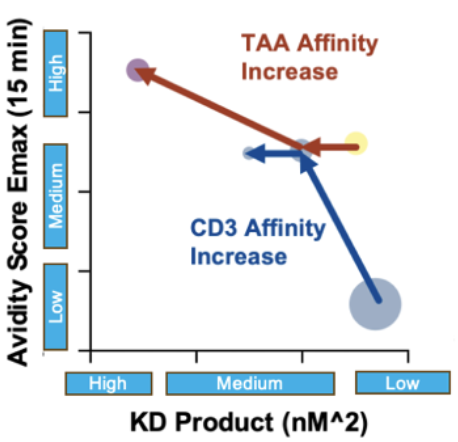
2. Together, the results create a quantitative map that explains how CD3 and TAA KD jointly contribute to optimal T-cell–tumor engagement and provides parameters to inform QSP models for design and translation.

3. Plot showing how cell avidity changes with increasing cell engager (CE) concentration for the candidates. There appears to be an optimal affinity balance that maximises avidity and therefore productive T-cell–tumor interactions.
Dive into the publication
Enhancing efficacy against clear cell renal cell carcinoma through format-tuning of bispecific T cell engagers
First-generation bispecific T cell engagers (BTEs) have shown promise in preclinical models but often suffer from a short plasma half-life due to their small size and absence of an Fc domain. Additionally, limited tumor retention can lower local therapeutic concentrations and impede efficacy. Cancer cells can even adapt and evade immune targeting through antigen heterogeneity and loss, threatening sustained responses. The immunosuppressive tumor microenvironment further hinders T cell function and promotes therapeutic resistance. To develop an effective strategy, any cell engager must overcome these barriers to achieve robust, consistent targeting and immune activation.
A team led by David Weiner, PhD have examined how format-tuning bispecific T cell engagers (BTEs) boosts therapeutic efficacy against clear cell renal cell carcinoma (ccRCC). Using a novel persistent multivalent T cell engager (PMTE) to enhance cell avidity and tumor targeting, they tackle challenges like low plasma half-life, poor tumor retention, and antigen escape. Optimizing cell interactions through avidity-driven design offers a pathway to more effective, durable cancer therapies and renewed hope for advanced ccRCC patients.
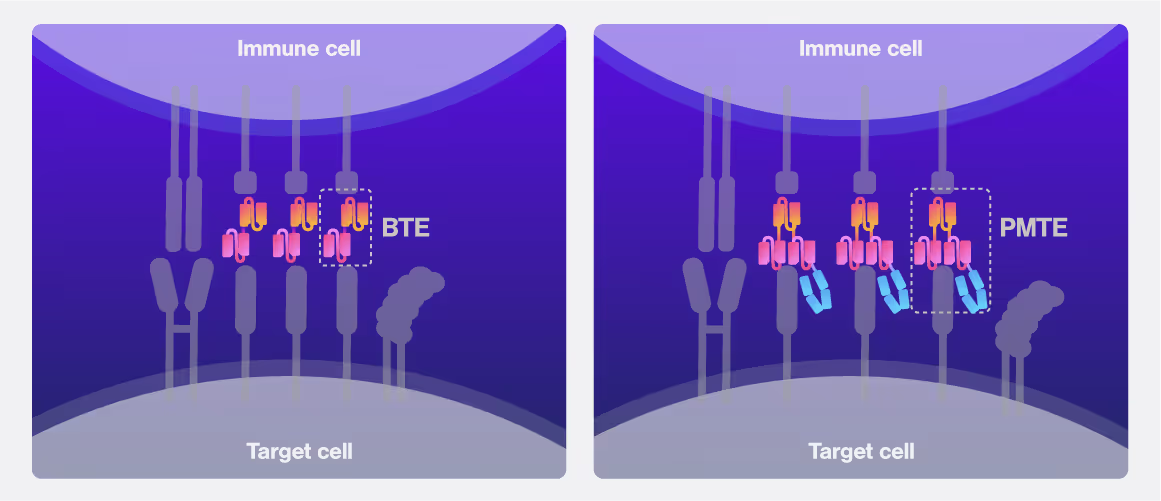

This study compared three BTE formats. Left: single-chain “BTE” with a tumor-targeting aCA9 linked to the T cell-targeting aCD3. Center: second-generation PBTE which reintroduces an Fc domain. Right: PMTE format which adds another tumor-targeting aCA9 part.

Cell avidity curves represent the % of target cells bound with rising detachment force measured at 30 nM, 3 nM and 300 pM antibody concentration. Area-under-curve quantifications indicate the significant differences in cell avidity between PBTE and PMTE at relevant concentrations. Adapted from: O’Connell et al. (CC-BY-NC)

Binding correlated with in vivo tumor cell-killing efficacy. Comparing the three BTE formats shows a significant delay in tumor volume increase between BTE, PBTE and PMTE. Data adapted from O’Connell et al. (CC-BY-NC)
Dive into the publication
Format-tuning of in vivo-launched bispecific T cell engager enhances efficacy against renal cell carcinoma
O’Connell, R. P. et al.
January 1, 2024
This is some text inside of a div block.
Solutions
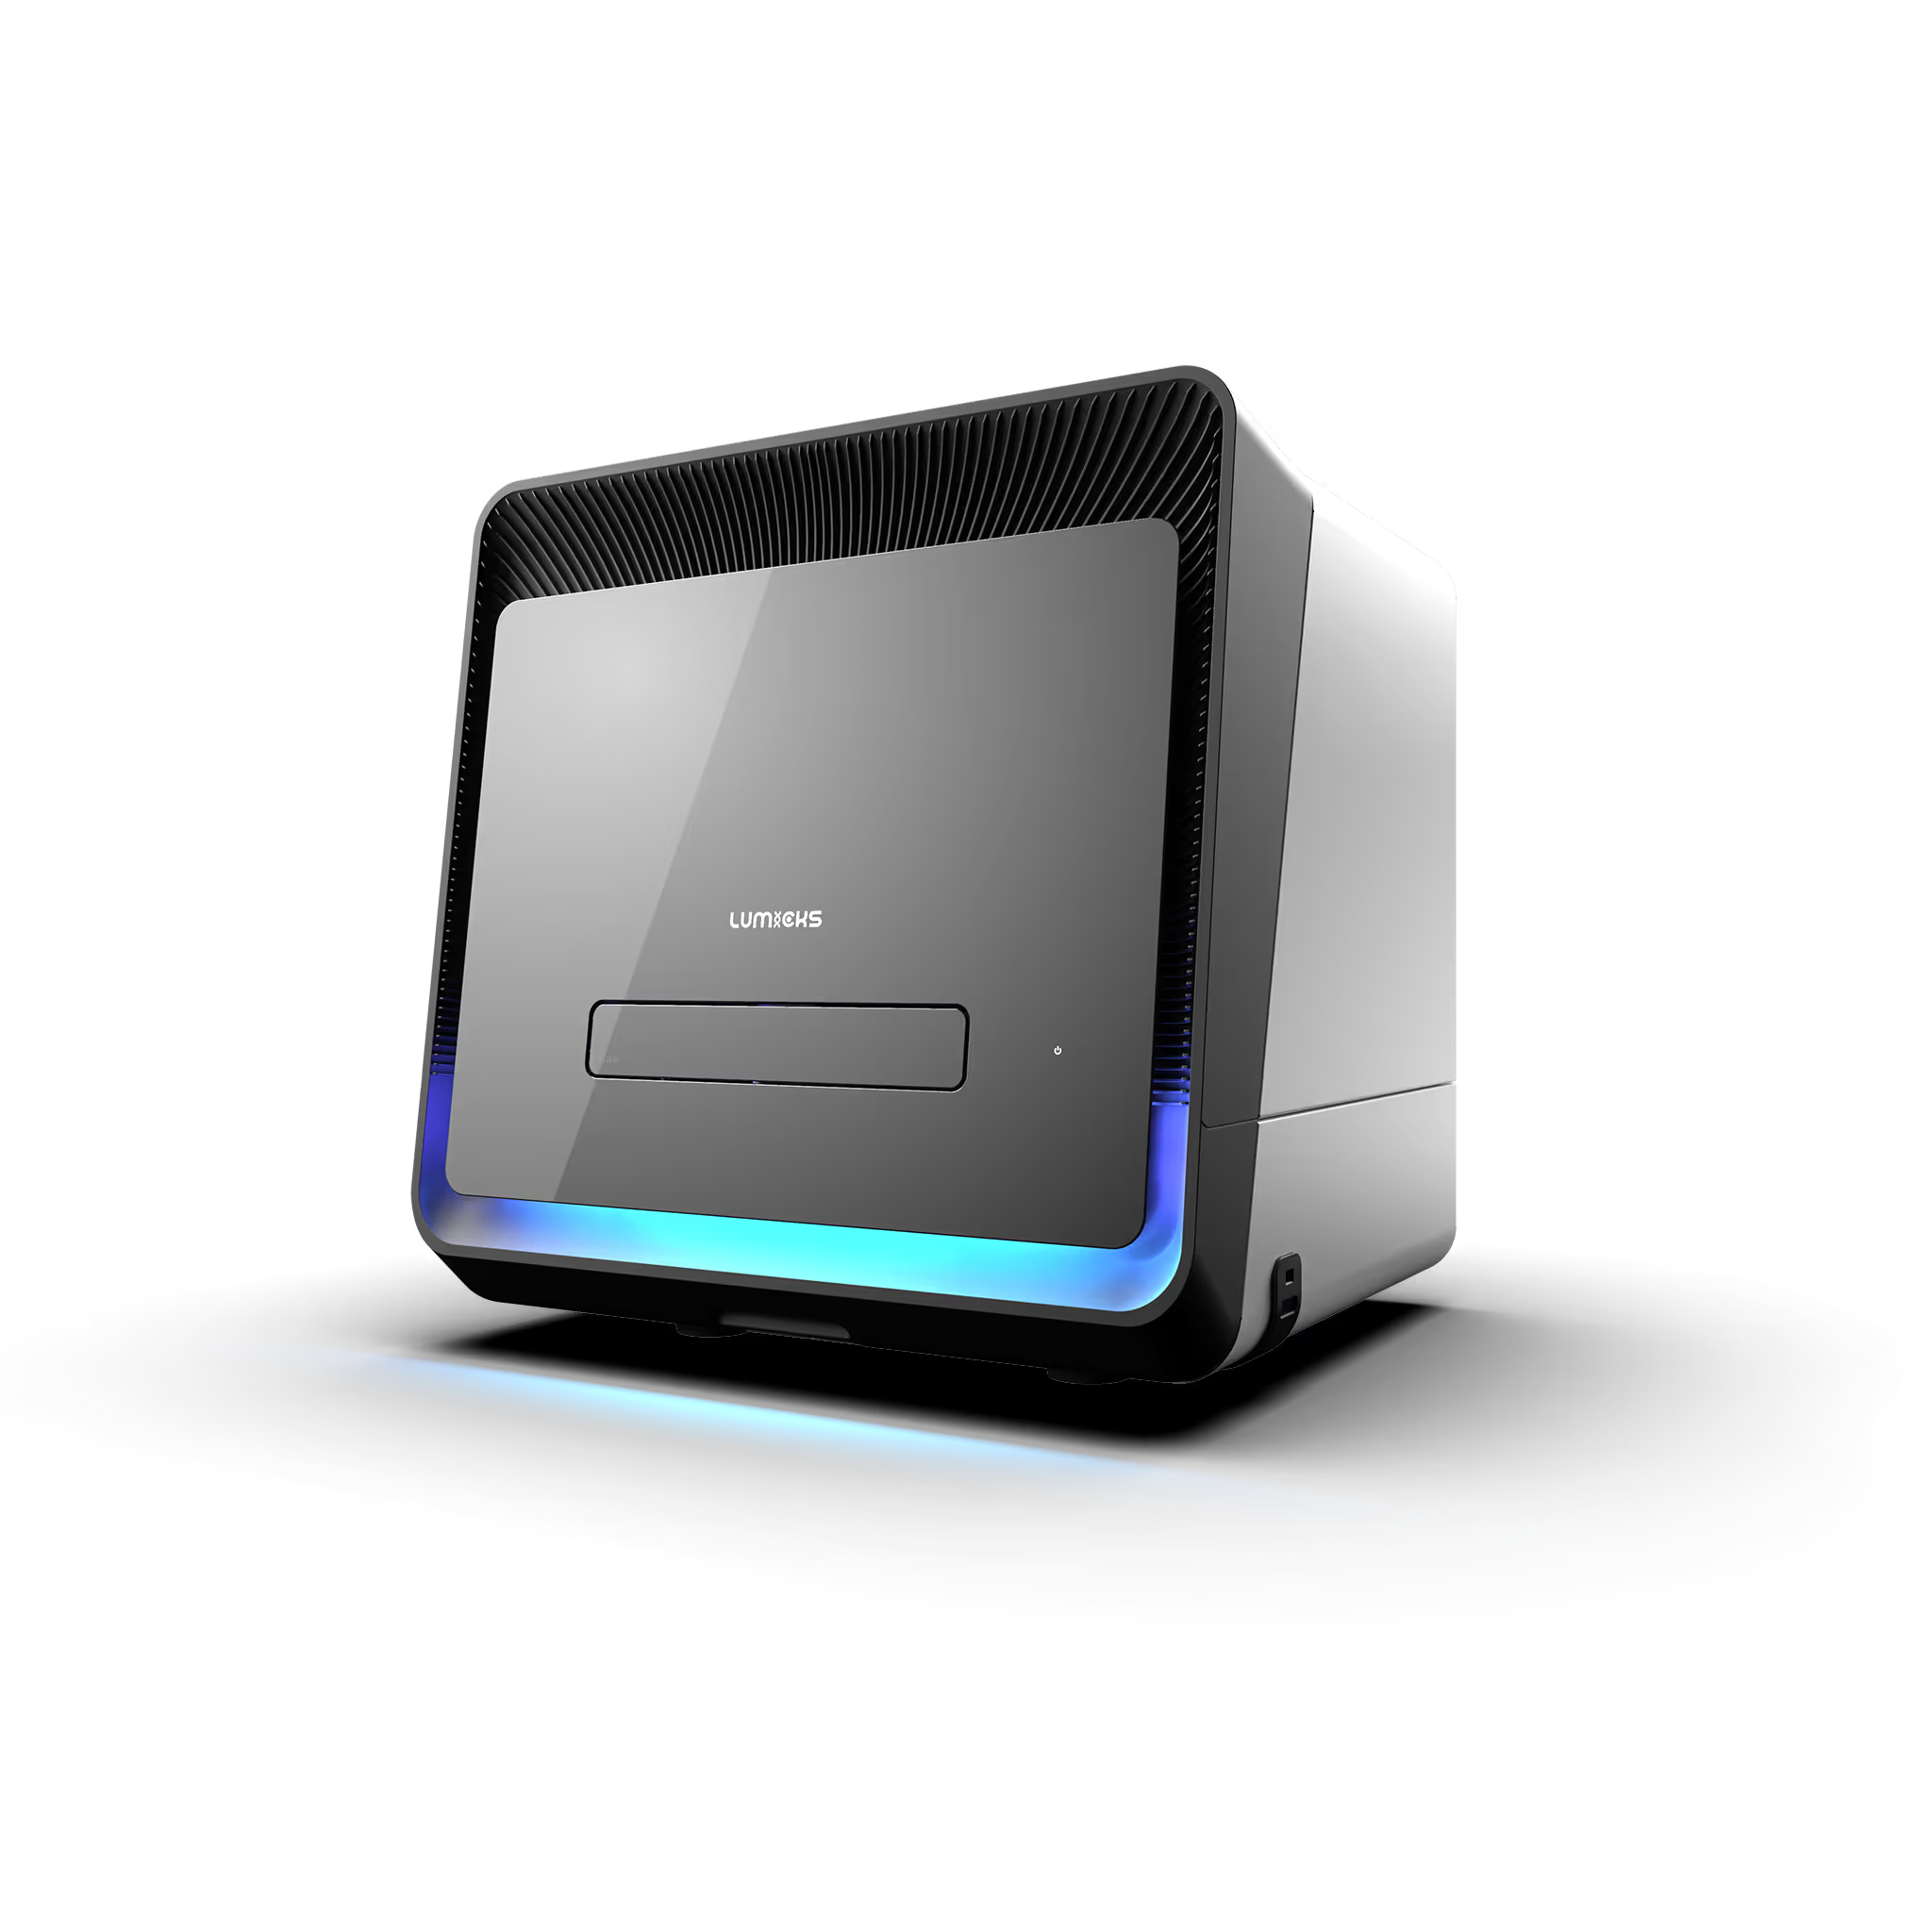
Avidion
The next generation Cell Avidity platform
Ideal for cell therapy candidate screening and large characterization studies. Run up to 4 disposable 48-well cartridges a day for a total of 192 measurements with <80 min. hands-on time.

Avidigo
White glove Cell Avidity services
Full-service contract research from experimental design to data report based on Cell Avidity measurements at high throughput.
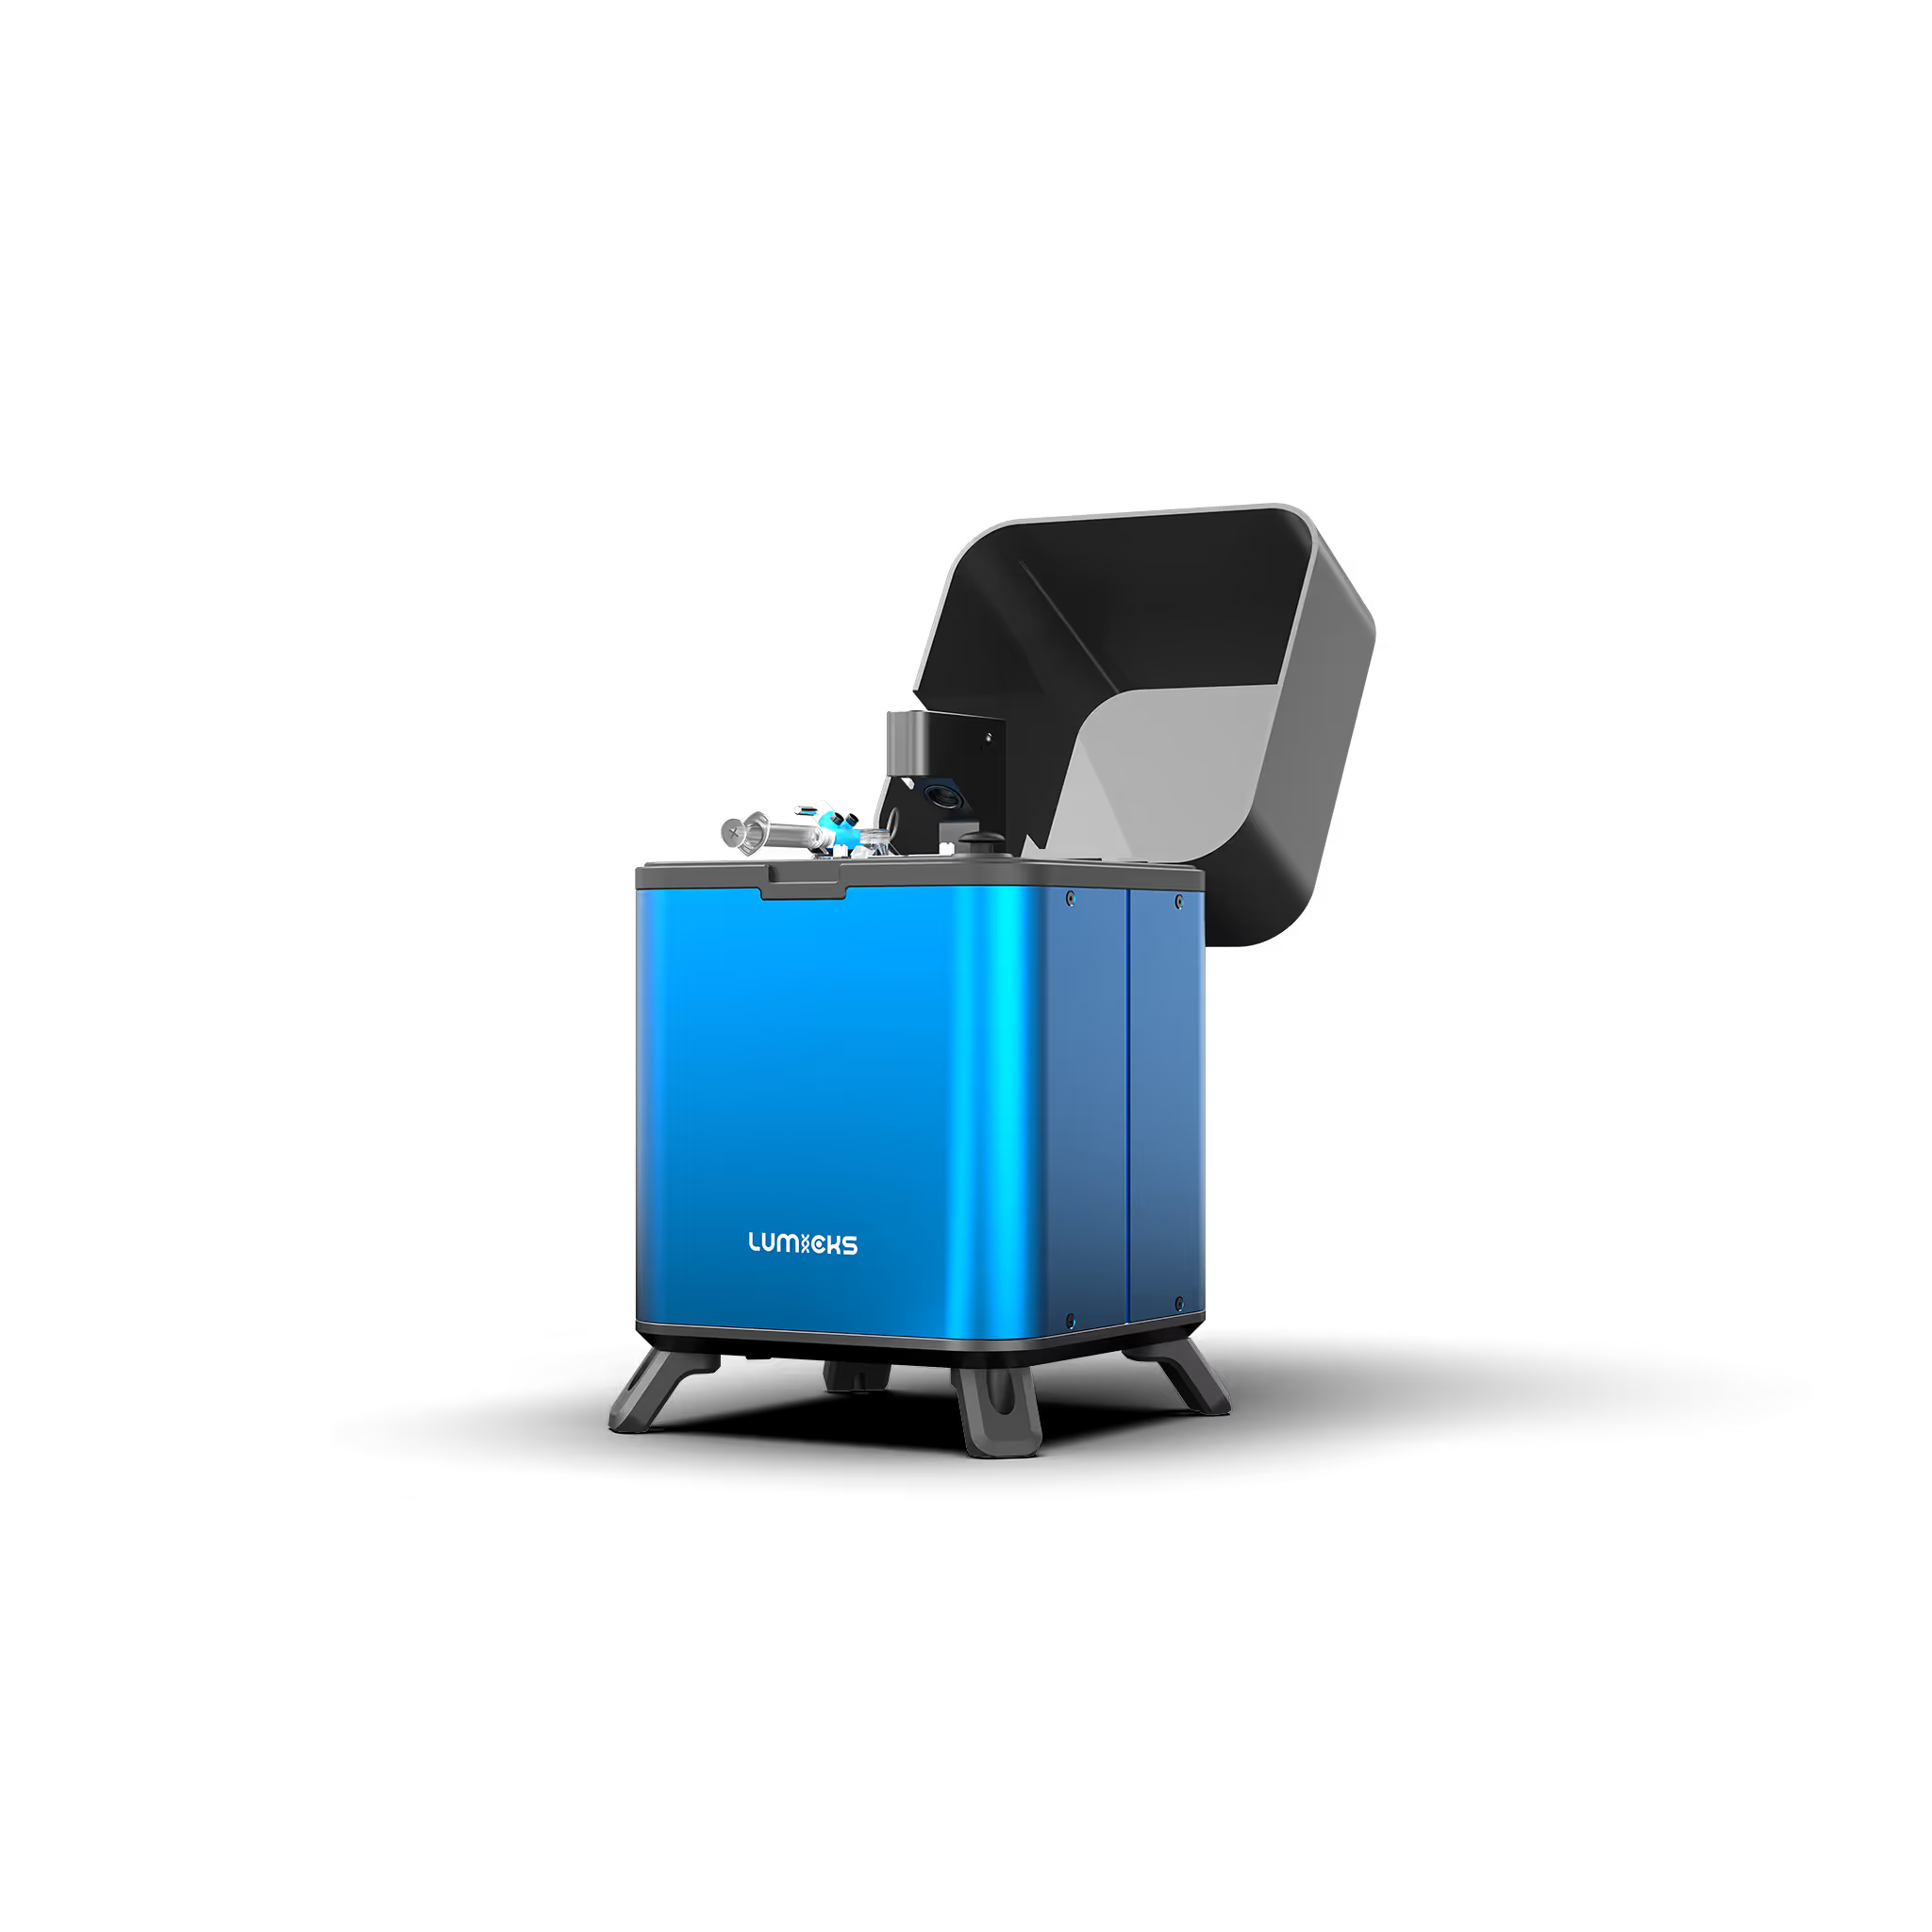
z-Movi
For small sized Cell Avidity studies
A fast and simple solution for single-sample Cell Avidity experiments. Run up to 20 measurements per day.
Technical note:
These cards are NOT components because they use the finsweet nested collection logic. To pull in the posible multiple people wo worked on it.
This type of 1-many relation is not supported native in Webflow.
Also this section is hidden when emtpy. To keep everything visible here, that is being done outside the webflow designer from within Slater.
No items found.




SITC 2025
Conference
April 22, 2025
01-01-20
This is some text inside of a div block.
CAR-TCR Summit 2025
Conference
April 22, 2025
01-01-20
This is some text inside of a div block.
CICON 2025
Conference
April 22, 2025
01-01-20
This is some text inside of a div block.